Research

Research Reports

Open

Breakouts: Pump Up the Volume

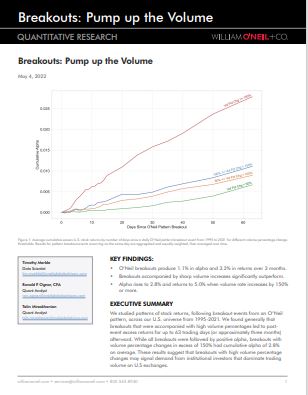
We studied patterns of stock returns, following breakout events from an O’Neil pattern, across our U.S. universe from 1995‒2021. We found generally that breakouts that were accompanied with high volume percentages led to post-event excess returns for up to 63 trading days (or approximately three months) afterward. While all breakouts were followed by positive alpha, breakouts with volume percentage changes in excess of 150% had cumulative alpha of 2.8% on average. These results suggest that breakouts with high volume percentage changes may signal demand from institutional investors that dominate trading volume on U.S exchanges.

Open

Price Gaps: Growing by Leaps and Bounds

This brief examines the performance of gap-ups and gap-downs segmented by style (growth/value) and size (large caps/small caps). Our team found that gaps generate much stronger momentum-like signals for growth stocks than for value stocks for both gap-ups and gap-downs. For gap-downs, they found a stronger bearish momentum effect for large-cap stocks than small-cap stocks.

Open

HOTNESS: HIGH TURNOVER HOT STOCKS EVENTUALLY GO COLD

In this paper, we explore the relationship between levels of speculative trading intensity (Hotness) and excess returns. We perform cross-sectional studies comparing the returns of Hot versus Cold stocks, which we differentiate with our proprietary measure of speculative trading intensity.

Open

GAP-DOWNS: THE BIGGER THEY ARE, THE HARDER THEY FALL

The brief highlights the effect of gap-downs on stock price performance over three subsequent months. The team compares price gap-downs from less than two standard deviations of average daily price move to more than four standard deviations in the U.S. market from January 1995 to September 2020 utilizing William O’Neil + Co.’s proprietary database.

Open

Volatility: Slow and Steady Wins the Race

Previous studies have found evidence of persistent underperformance of high-volatility stocks compared with lower-volatility stocks on a risk-adjusted basis. Consistent with prior studies, our cross-sectional research found that U.S. stocks in the top (highest) volatility quintile significantly underperform those in the bottom (least volatile) quantile such that long-short portfolios constructed on the basis of volatility quintile rankings generate significantly negative returns while remaining market-neutral. These volatility Q5–Q1 portfolios have positive exposure to size (SMB) and negative exposure to value (HML). However, these portfolios are prone to short-term losses during bear markets.

Open

Mind the Gap Size: Look For Two Sigma or More

In this paper, we studied patterns of stocks returns following price gap events across our U.S. universe from 1995–2020. We found generally that the size of the gap was sig-nificantly related to post-event excess returns for up to 10 weeks afterward. Gap-ups of less than two standard deviations (2σ) were generally indistinguishable from zero in terms of cumulative alpha expectations, however, gaps of 2σ to 4σ in magnitude had cumulative alpha of 1.06% on average, which rose to 2.19% for gap-ups greater than 4σ. These results suggest not only that incorporation of the arrival of new information into prices occurs with a tradable delay but that such effects are stronger as a function of the magnitude of information implied by the size of the gap.

Open

RS Rating: Pharma Flameouts and Small-Cap Values

In this paper, we perform a collection of segment-wise comparisons of the strength of William O’Neil + Co.’s proprietary Relative Strength (RS) Rating as a useful signal for identifying portfolios of stocks likely to outperform and underperform using quintile-based long/short portfolios constructed using the RS Rating. We compare on the basis of style (growth/value), size (large cap/small cap), market (U.S., China A shares, Hong Kong, and India), and industry sector.

Open

RS Rating: It’s All Relative

In this paper, we demonstrate the effectiveness of William O'Neil + Co.’s Relative Strength (RS) Rating™ in picking stocks expected to outperform (or underperform) the market in the future such that they can be used to form market-neutral strategies that extract positive returns while hedged against broader market exposures.

Open

New Highs: Segmentation

We compared post-event performance for one year following five-year new highs, segmenting our results by style (growth/value), size (large cap/small cap), market (U.S., China A-shares, Hong Kong, and India), and industry sector.

Open

New Highs: Best Served Rare

We build on our prior studies of new highs in our U.S. universe by segmenting each event according to the number of new highs occurring that day, comparing performance between bins of 1–49, 50–99, 149–199, and 200+.